Creating an Exploration
Start exploring by dragging fields
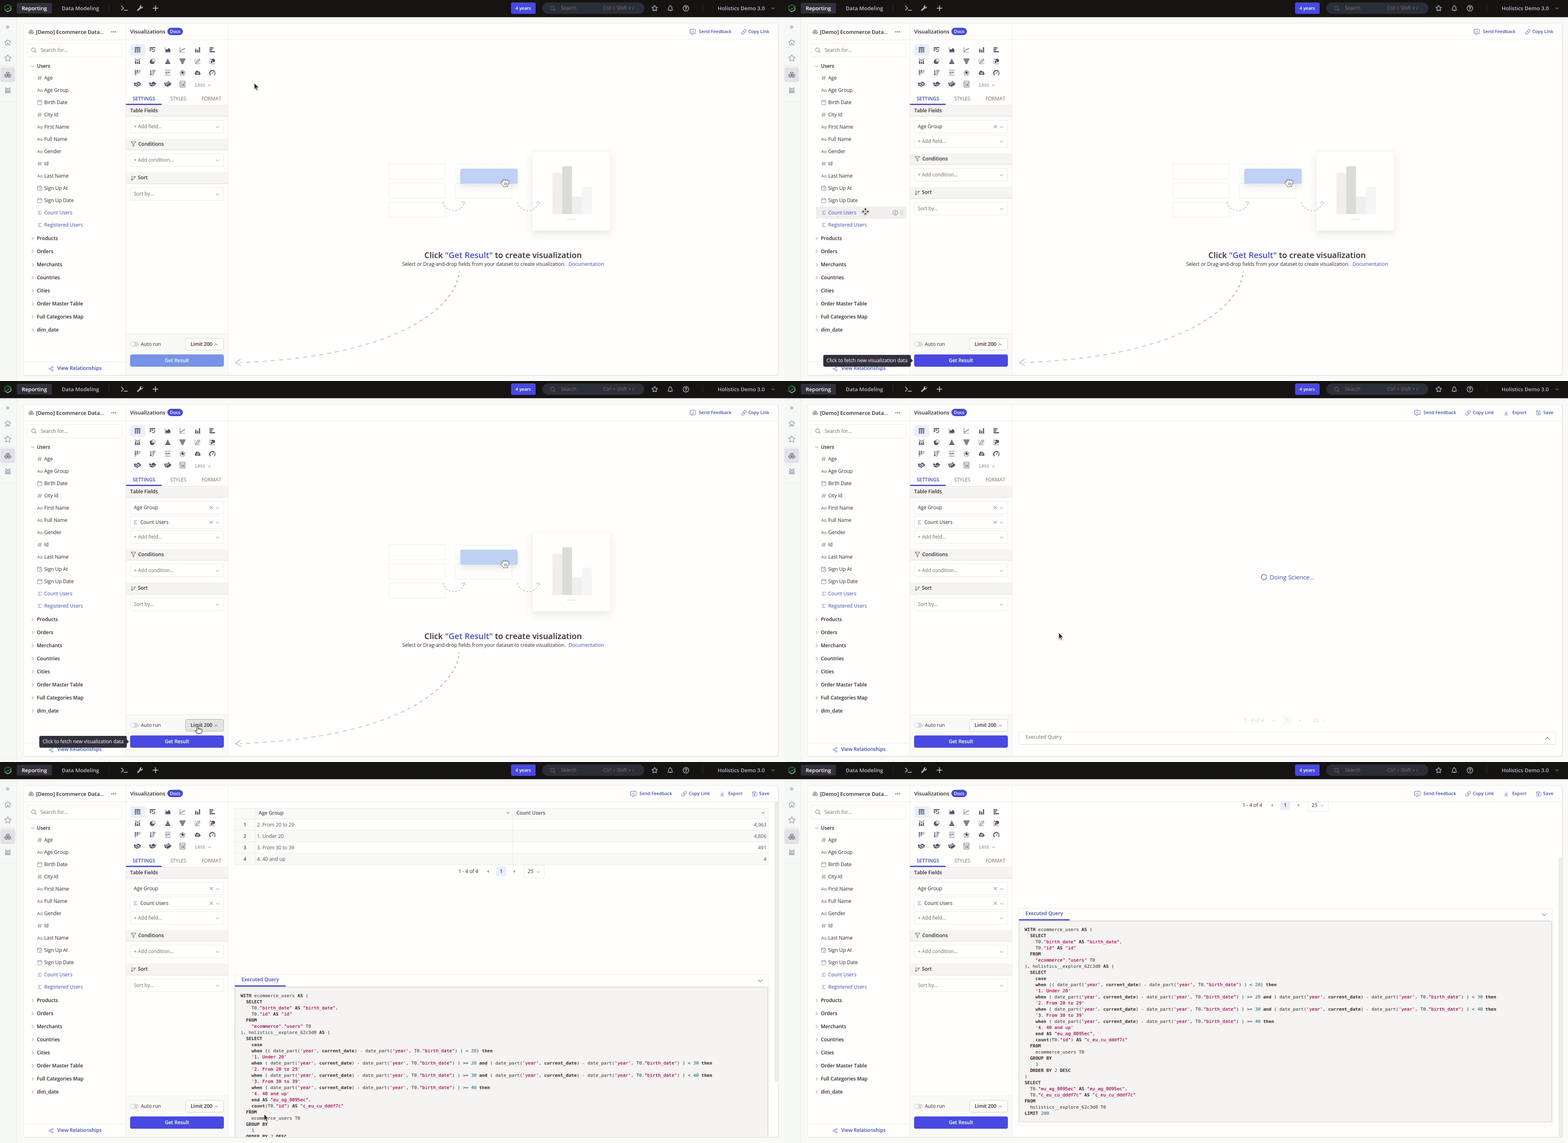
You can start exploring and building charts/ reports by adding fields from the Data panel to the Visualization Settings panel, and click Get Result. As you build a chart, you can add as many fields as necessary, and then move those fields around as you explore your data.
Behind the scene, Holistics will use the metadata from the models and fields to construct a query to be run against your database.

You can also add a new field by clicking on the + Add field area and select the field from the dropdown list. From here you can also add new Business Calculations.
Limiting data
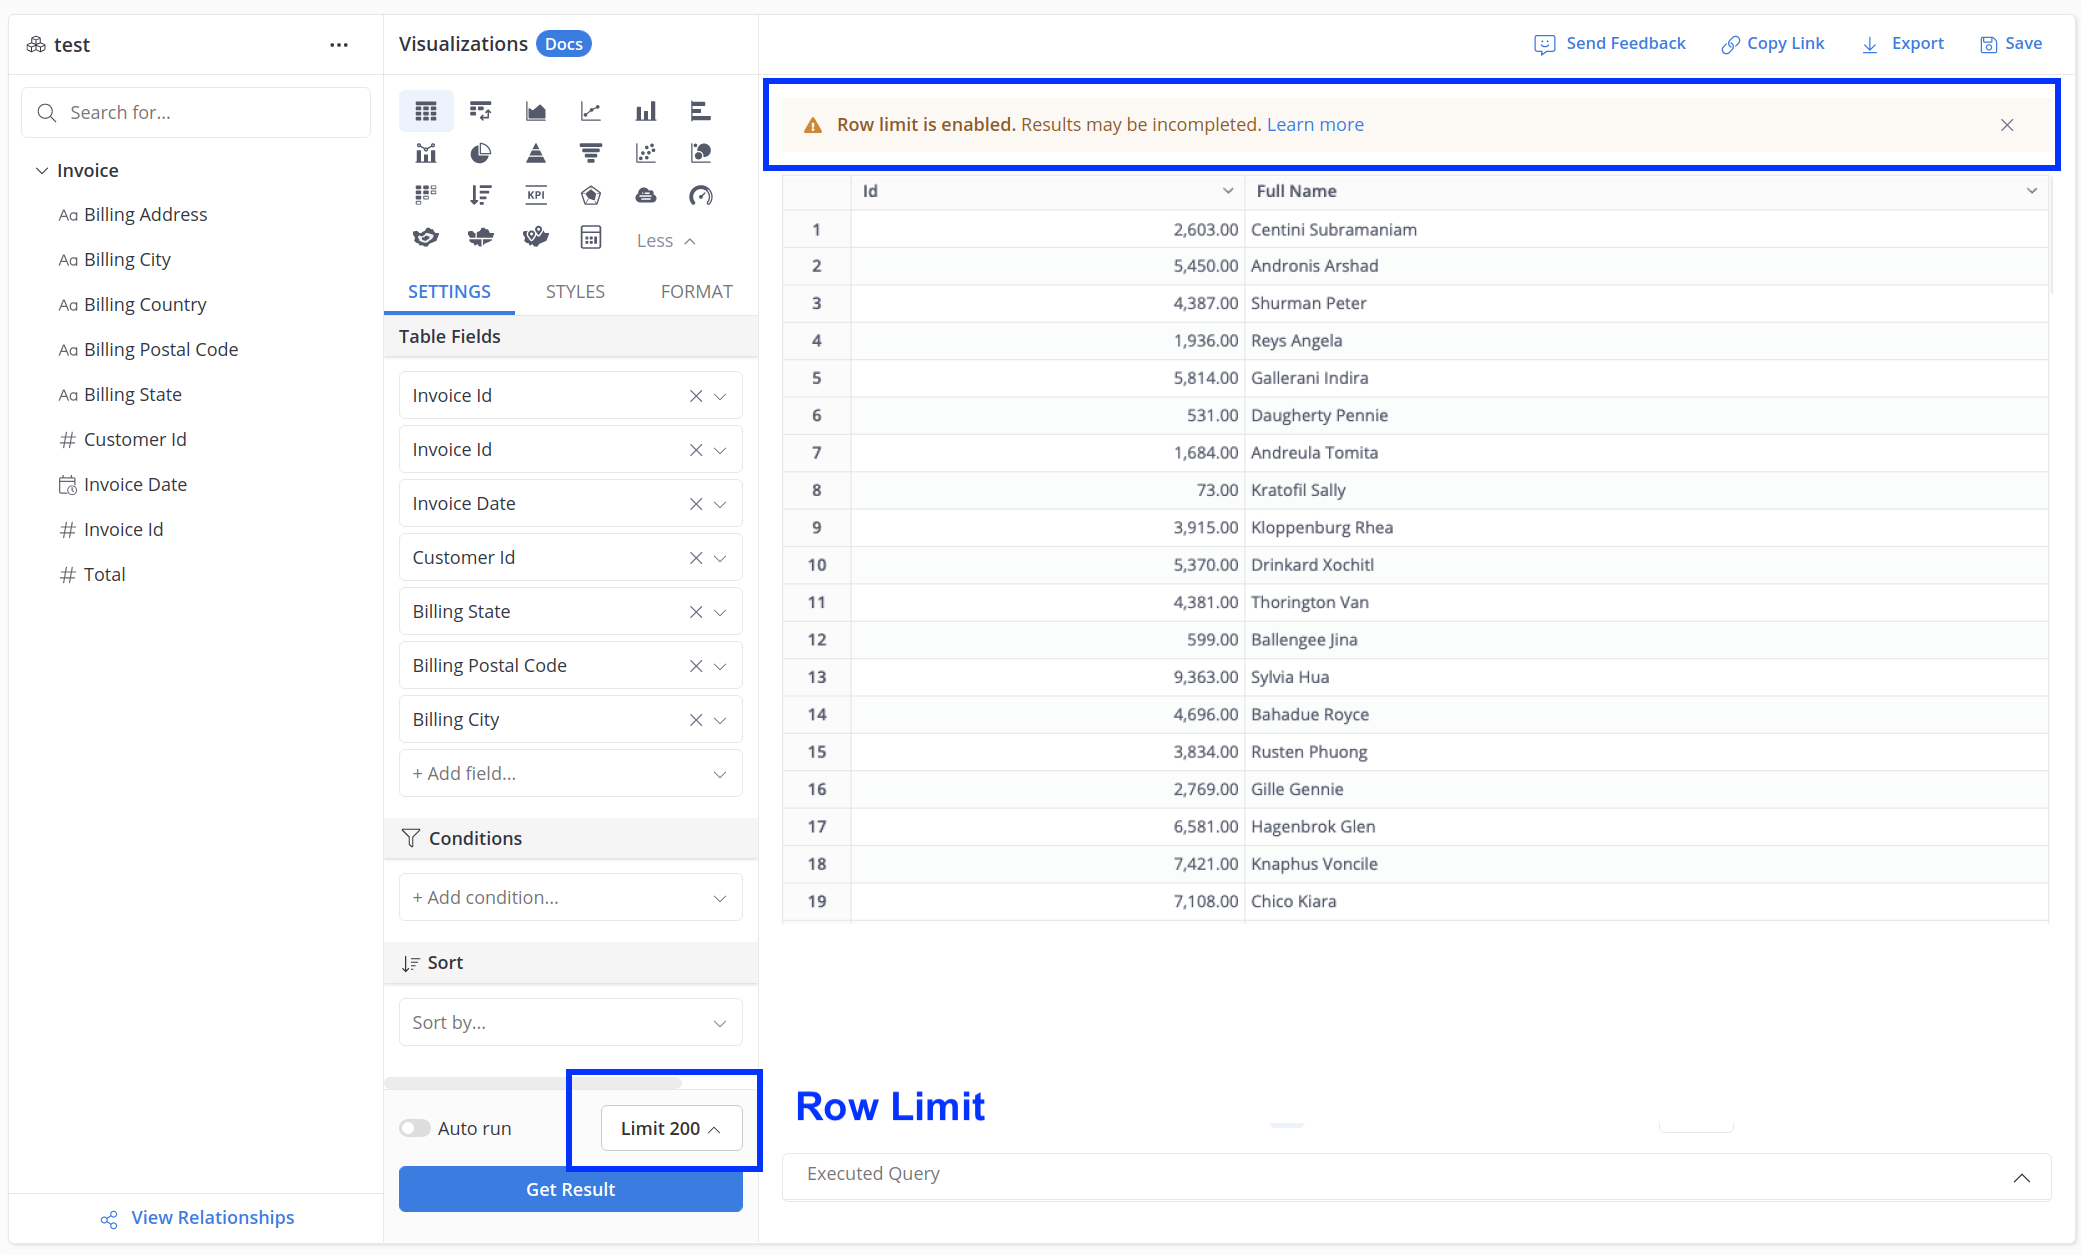
Sometimes, to speed up the process of exploring data, you only want to see a subset of your complete results from your query. You can do this in Holistics by using our Row Limit feature:

Without a set row limit, Holistics will apply the default limit configurations for Data Exploration, Report Export and Data Modeling Preview.
When you set a row limit, Holistics will only display up to the number of rows you have set, and let you know about your incomplete results.
- The Row Limit is directly applied on your query.
- Our sort order is important in these situations: Holistics will first applies the limit, and then applies the sort.
Troubleshooting
Fan-out issue
This issue has been solved with our new product version, Holistics 4.0. For more details: FAQ: Fan-out Issues
Please be mindful of possibilities that the fan-out issue may occur while you do data exploration.
When you set relationships between models (many-to-one or one-to-one ), we assume that the fields at the "one" end is already unique.
If the field is not unique, when you drag in fields from those two models, a fan-out will happen. The result set will be a Cartesian product of the two models and may "explode" into millions of rows.
Visit Cannot combine fields due to fan-out issues? to learn more about this error and how to troubleshoot it.
