Setting goal/target in Holistics
Introduction
Currently, Holistics does support goal setting directly, but you can still visualize your metrics and goals using the current mechanisms. In this article, we will walk you through the steps to do so, from data preparation to visualization.
Context
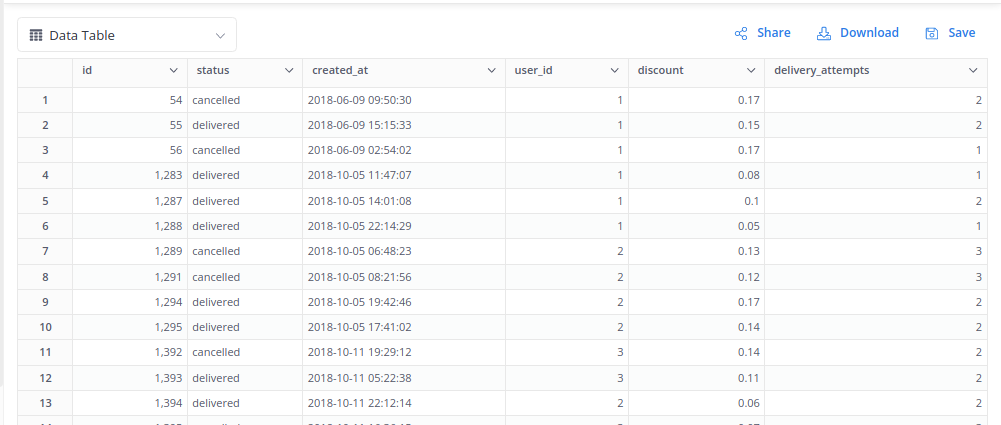
In this article, we will use the classic e-commerce dataset, but the principle is the same if you are in other business domains. Suppose your source data is a table containing orders/events like so:

Let's say you care about the number of orders created monthly, and you want to set a goal for this metric.
The example uses PostgreSQL, but the general idea should be applicable to other SQL flavors.
General approach
To visualize the goal number, you will need to add your number as a column alongside your metrics column
| report_time | total_orders | order_target  |
| ----------- | ------------ | ------------- |
| 1           | 123          | 2000          |
| 2           | 234          | 2000          |
| 3           | 432          | 2000          |
| 4           | 100          | 2000          |
| 5           | 156          | 2000          |
If your goal is static
If your goal is just a static number, then you can simply add it as a custom dimension to your model.

The result will look like this:

To avoid the wrong number happening when using date-drill, the static goal-line should be used with Min/Max Aggregation type in Visualization.
If your goal is dynamic
Sometimes, the goal of your metrics are not static and involve multiple tables. Imagine that you have a table that contains the monthly sales goal:

If you’re well versed in SQL, naturally you will write a query to calculate your metric and join it with the goal table:
with aggr as (
  select
    date_trunc('month', created_at::date) as report_time,
    count(*) as total_orders
  from ecommerce.orders
  group by 1
) -- to pre-aggregate the orders by month

select
  aggr.*,
  tgt.order_target
from aggr
left join ecommerce.sales_target tgt on aggr.report_time = tgt.report_time
Result:

You can then save this as a Transform Model.
Visualization
After transforming the data, you will need to create a Dataset to visualize it.
 Since we used the Transformation to pre-aggregate the metrics, the metric and the goal will be available as Dimension fields in the Holistics Transform/SQL model.
The sections below will demonstrate how we visualize these fields in Metric Sheet, Combination Chart, and Metric KPI visualizations.
Metric Sheet
If your desired outcome looks something like the table below:
| Metrics      | Aug 2021   | Sep 2021   | Oct 2021   | Nov 2021   |
| ------------ | ---------- | ---------- | ---------- | ---------- |
| Order Target | 2000       | 2000       | 2000       | 2000       |
| Total Orders | 2288       | 2431       | 2949       | 1463       |
Holistics' Metrics Sheet visualization will do the trick. This is the type of chart that brings all of your key metrics into a single spreadsheet, giving you a bird's-eye view of your business. You can find more details here: https://docs.holistics.io/docs/charts/metric-sheets
Choose Metric Sheet in the Visualization Settings and drag in the Target and Actual Order Quantity field.
The result will look like this:

Combination Chart
Use Combination Chart when you want to compare your goal metric to other metrics over time.
Similar to Metric Sheet, at Visualization Settings simply choose a Combination chart for visualization. Drag in Order Target and Total Orders in Y-Axis for comparison.
Result:

Metric KPI
If you just want to display the goal metric as a single value, Metric KPI is what you need. Drag in your Total Orders dimension in the Value and the Order Target dimension in the Comparison Value.
The result will look something like this:
 Metric KPI also has different styling options for your preference. Please refer to this doc for more information: https://docs.holistics.io/docs/charts/metric-kpi#styling-options
Result:
