Custom Charts
Step-by-step tutorial to create a custom chart: How to create a custom chart from Vega-Lite library
 Visit Holistics Custom Chart Library for example codes.
- Custom Chart feature is available to all customers in Standard Plan and above
- For customers who are eligible for this feature but cannot find it in-app, or customers in Entry Plan and would like to give this feature a spin, please let us know via this form: Holistics's Support Ticket
Introduction
Sometimes, Holistics' default visualization types may not be enough for your business needs. You may want to use charts that we do not support yet, or create a more customized chart type with modifications specific to your organization. The Custom Chart feature is, therefore, introduced to help you create custom, reusable chart templates that accommodate your needs.
Video tutorial
Below is a video tutorial of Custom Charts. The video covers:
- What Custom Chart is, and when you will need it
- A quick look into how Custom Chart works
- A hands-on example of building a Custom Chart from scratch.
High-level mechanism
Custom charts can also be created using Vega syntax within our Custom Chart feature. While we don't have a specific Vega tutorial yet, it's worth noting that Vega and Vega-Lite share the same mechanism for custom chart creation.
Custom Charts are user-defined chart templates written using Holistics and Vega-lite syntax. Once created, it is available to everyone in your organization to use.
The creation of a Custom Chart typically follows these steps:
- An Admin creates the chart definition.
- Other users within the organization can select the new chart type to build reports.
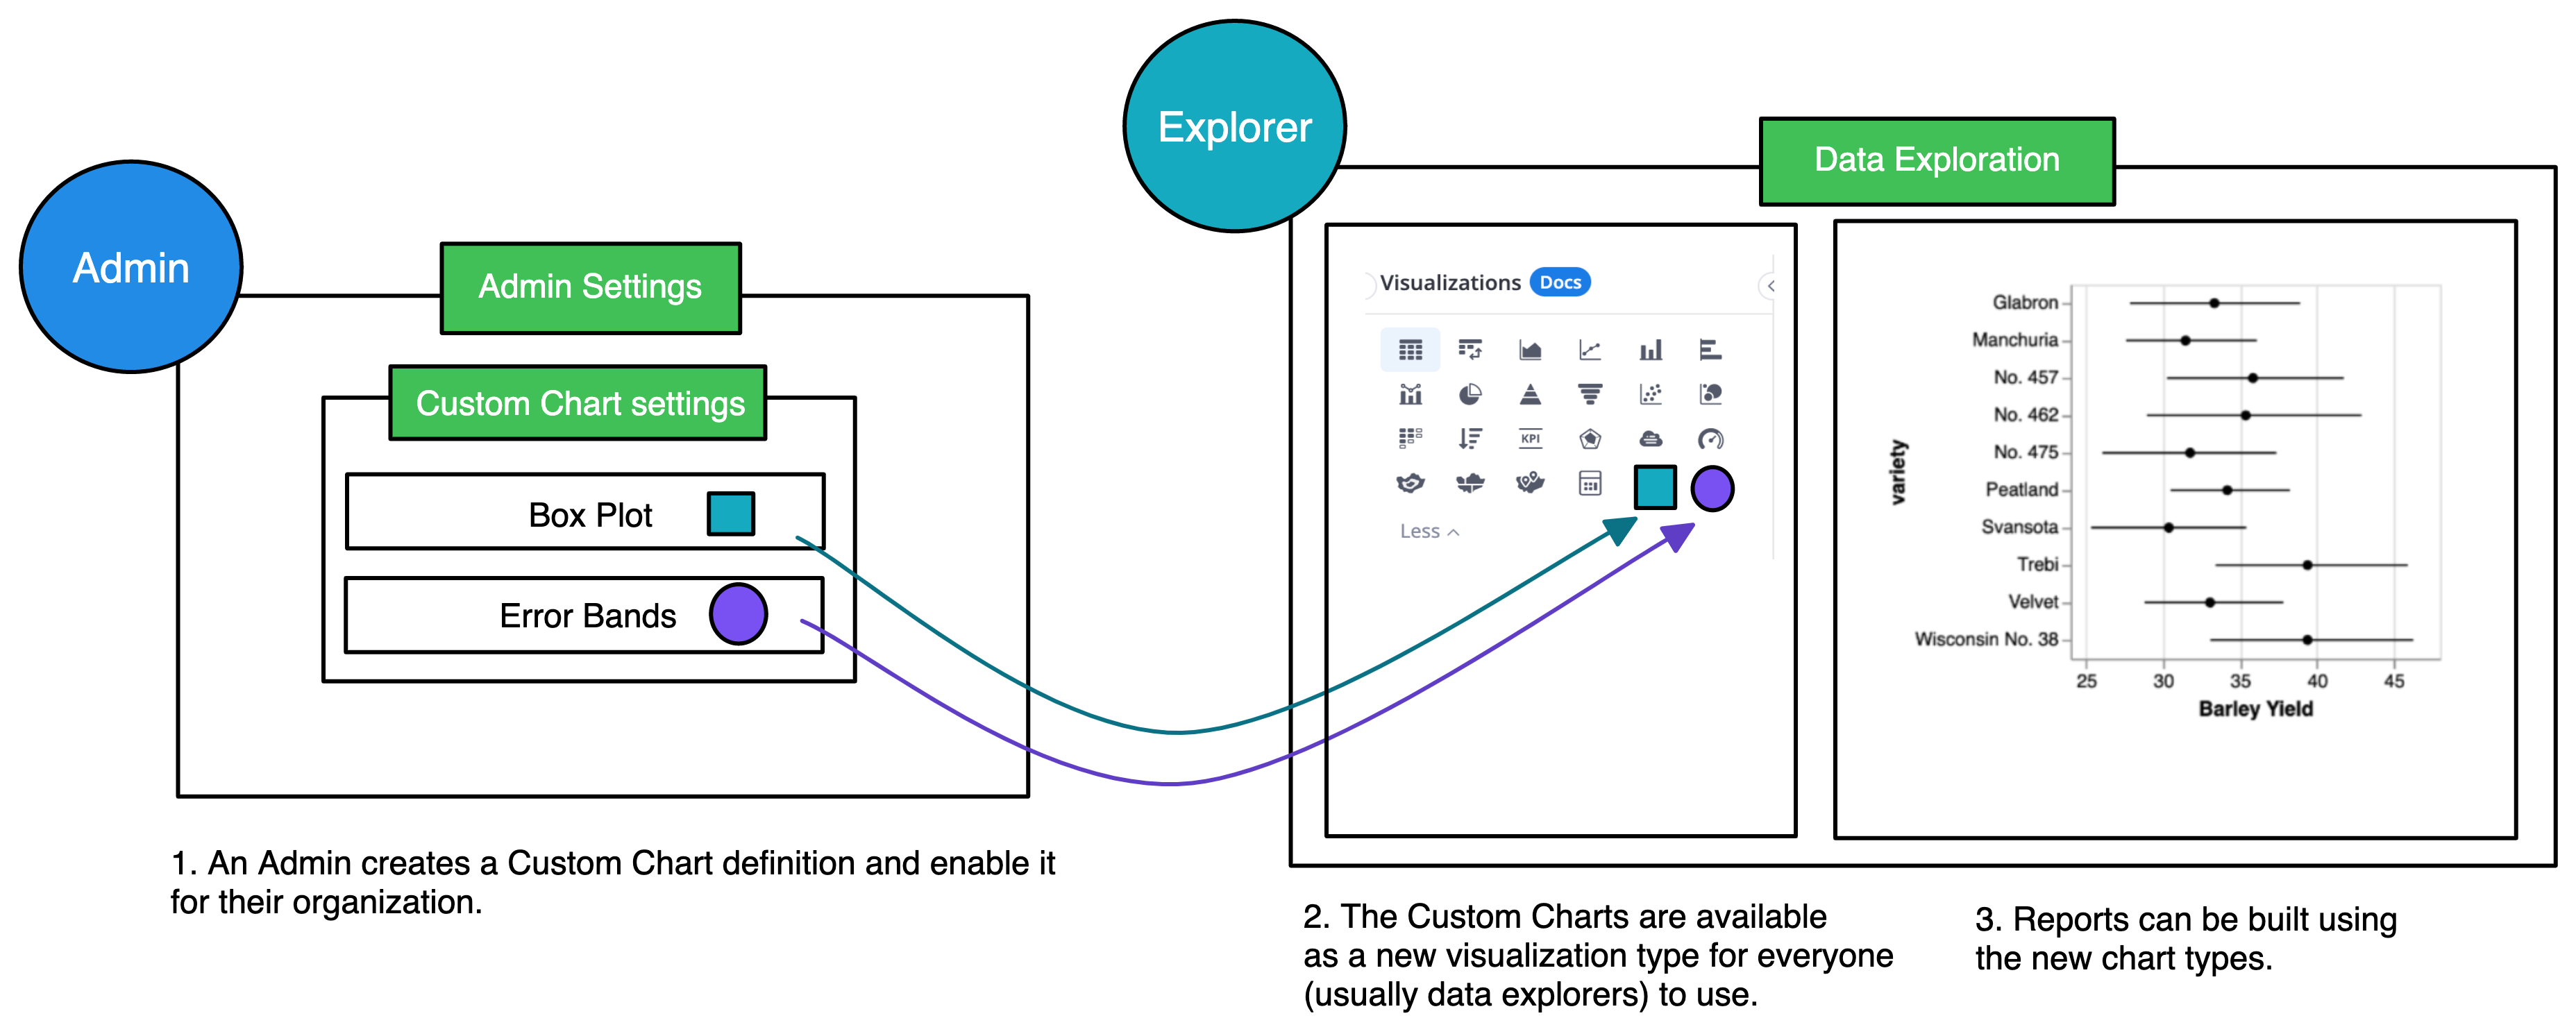
Structure of Custom Chart syntax
At the heart of a Custom Chart is the chart definition written using Vega-lite, a grammar of interactive graphics combined with Holistics syntax.
The Vega-lite syntax specifies how the visualization should look. The Holistics syntax is to declare Holistics-specific configurations that make the chart work in Data Exploration.
The chart definition typically is comprised of three (03) main parts:
You can refer to the mapping below to visualize the responsibility of the template's sections.

How to add a Custom Chart
Only Admins are authorized to create custom chart definitions.
Go to Menu -> Settings > Custom Chart and click on Add a Custom Chart.
Then add your Custom Chart's name, (optional) icon and definition. Hit Save to save your newly-created Custom Chart.
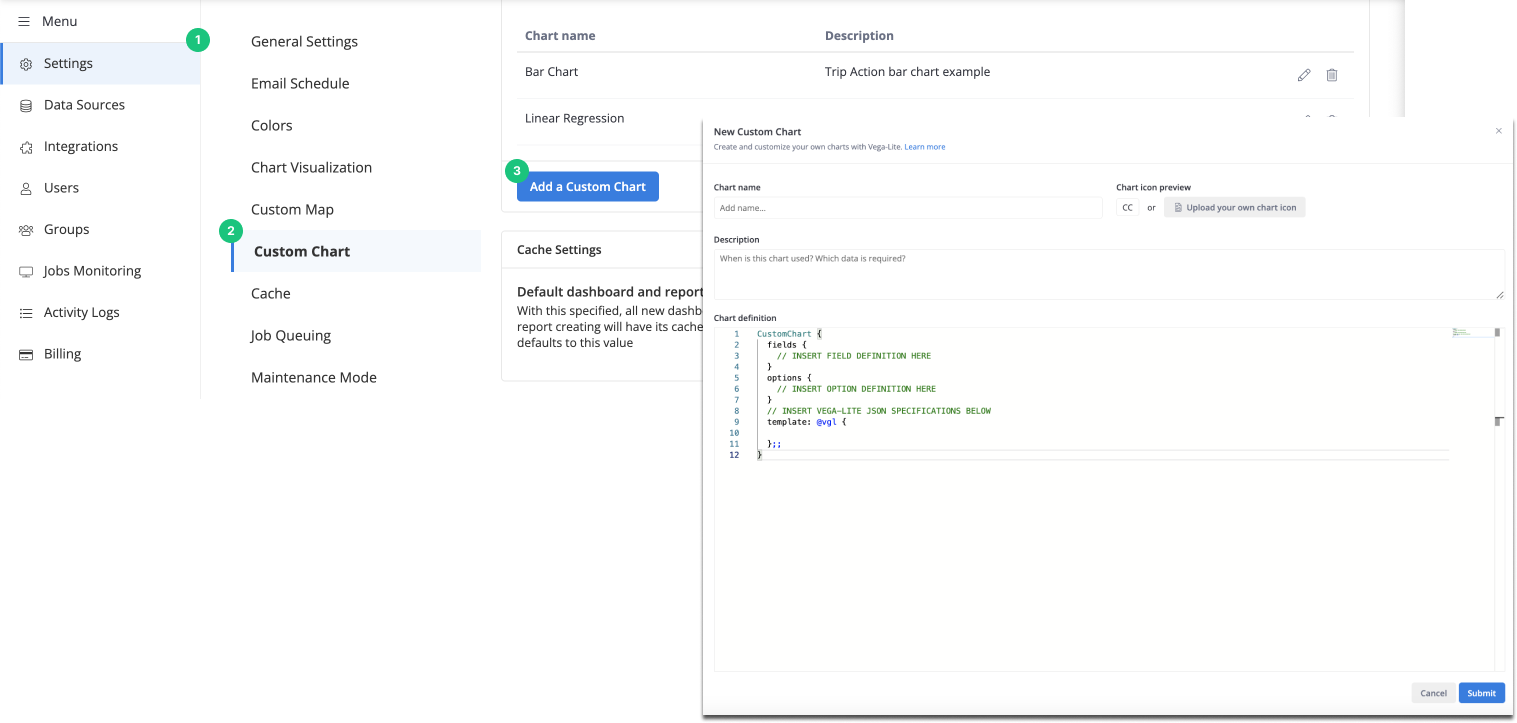
Custom Chart syntax overview
Field definition overview
This is written in Holistics Syntax. This section is where you define configurations for the fields in your chart. Holistics will read these configurations and prepare the input boxes to drag-and-drop dataset fields in the Exploration View.
When you drag the fields into the boxes, the fields' values will be passed into the Vega-lite chart template.
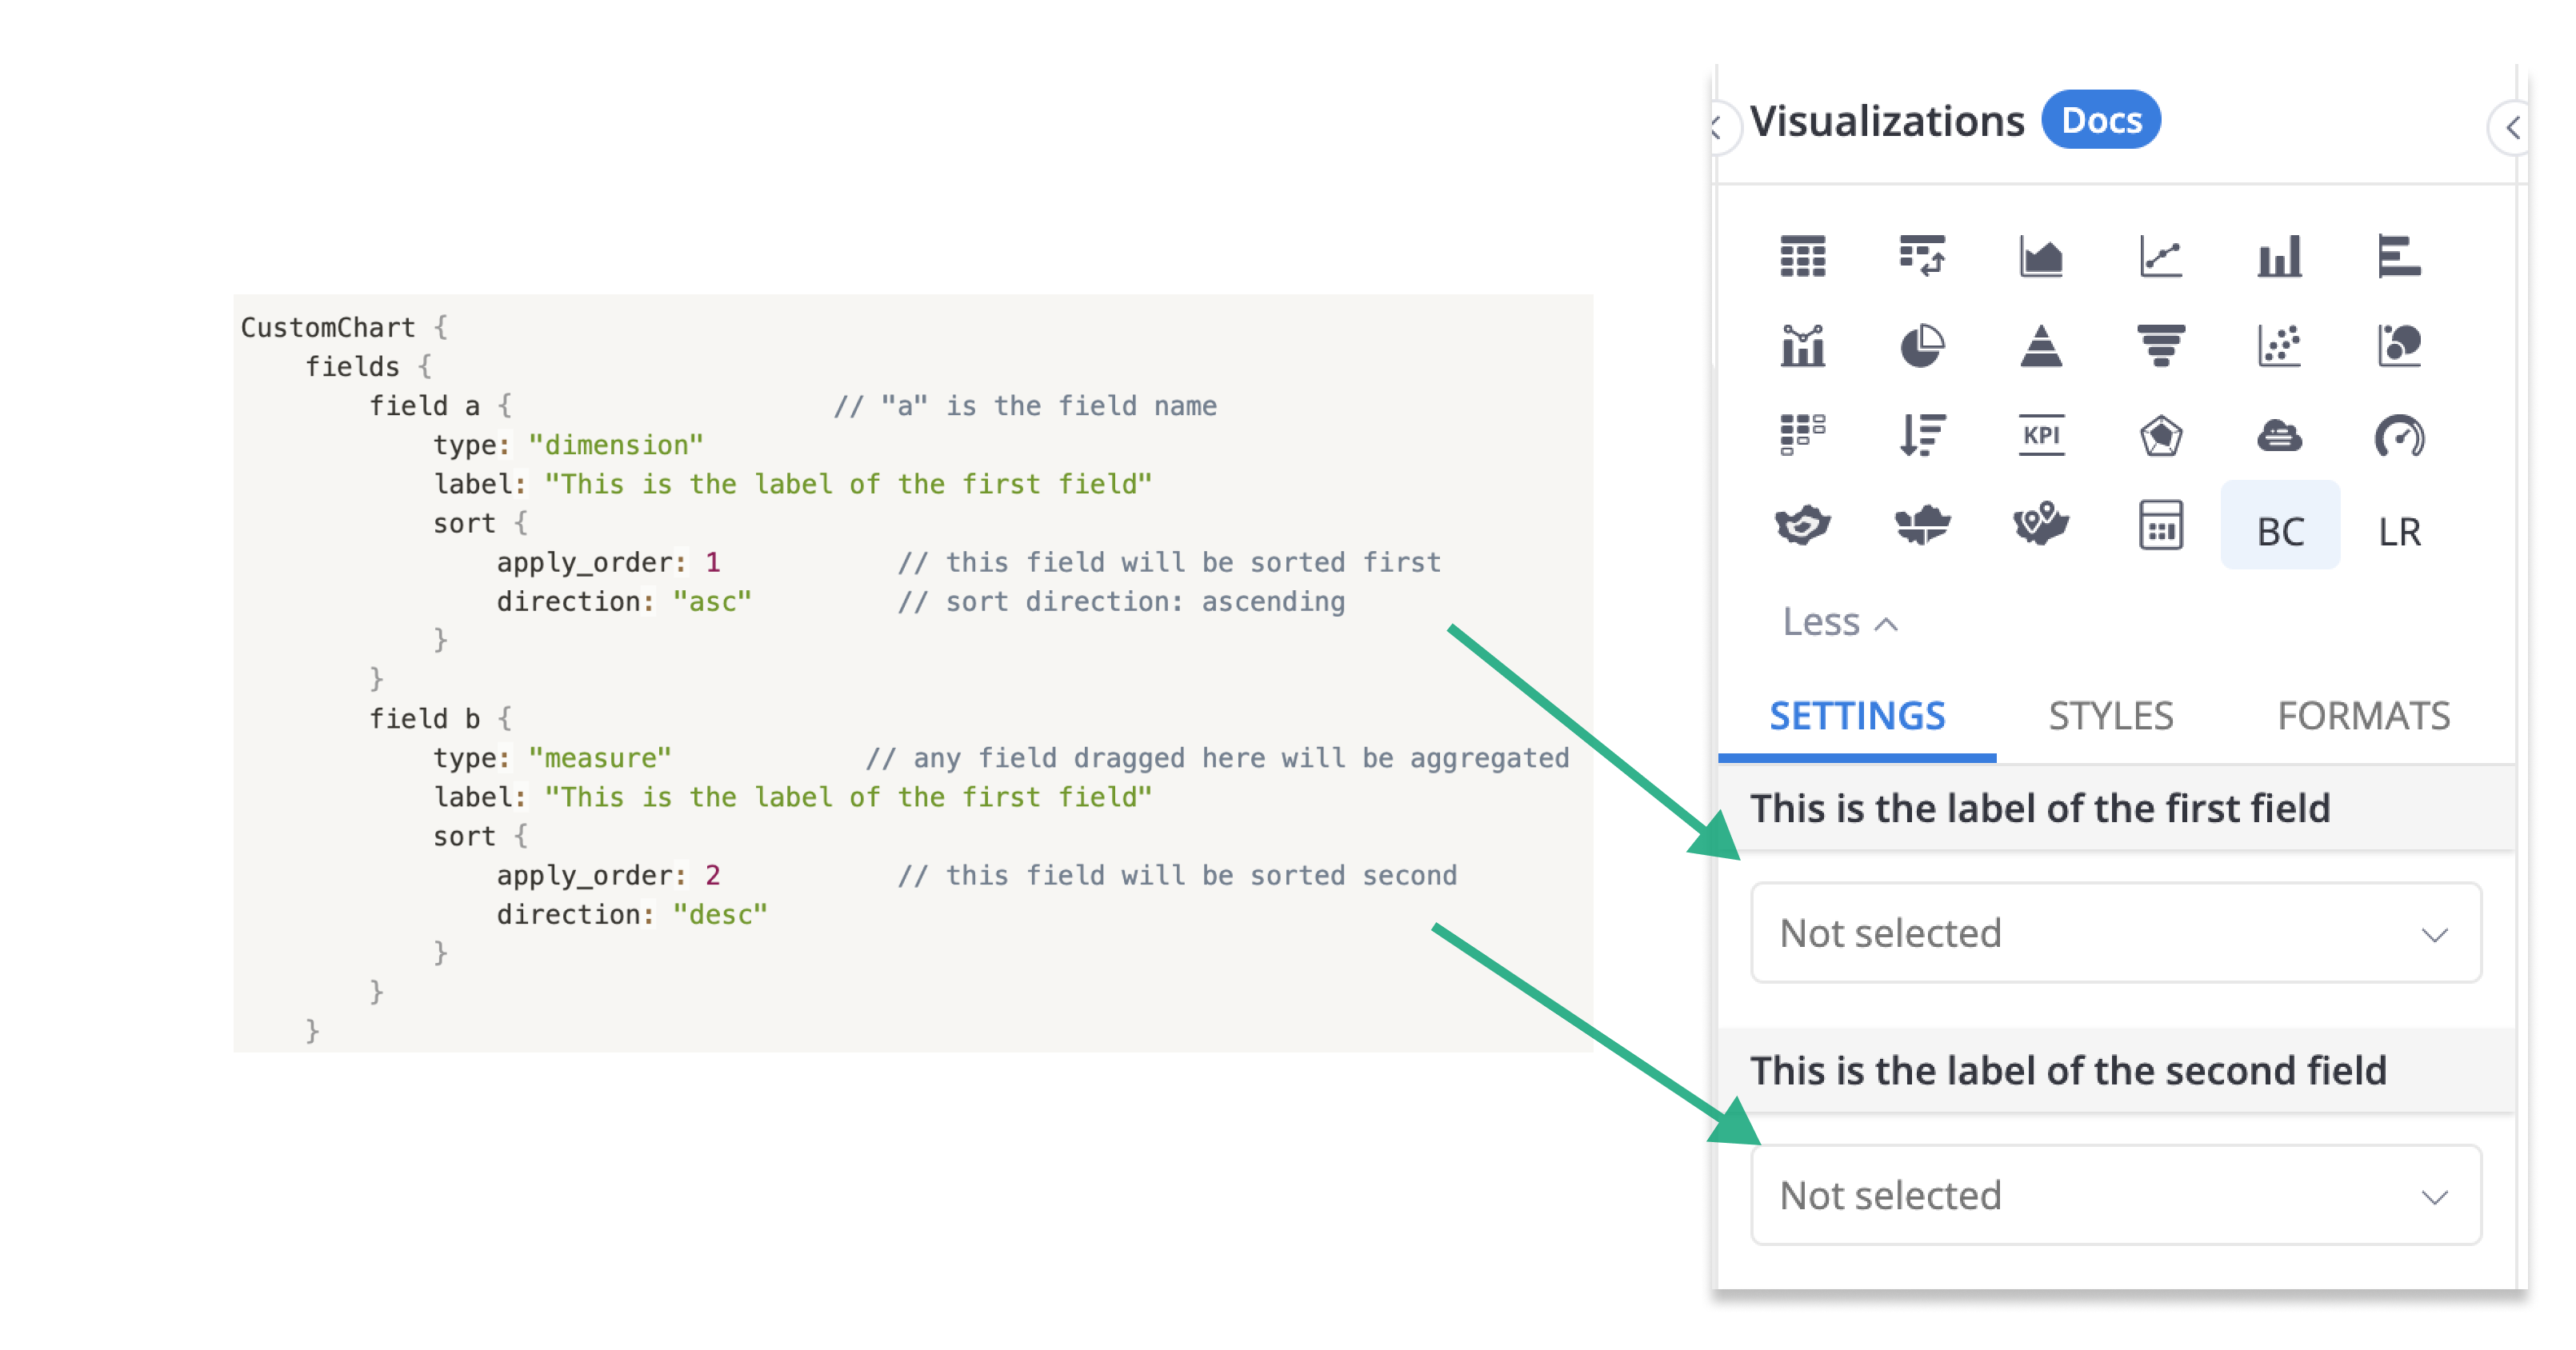
To learn more about the properties of field, visit Custom Chart properties.
Option definition overview
This is written in Holistics Syntax. This is where you define the styling options your chart accepts, such as tooltip visibility, goal line value or histogram bin size customization, etc. These options can be found in Styles tab in Data Exploration view.
For example, you want to give users the option to toggle on/off tooltip. Your Tooltip Option could look something like below:
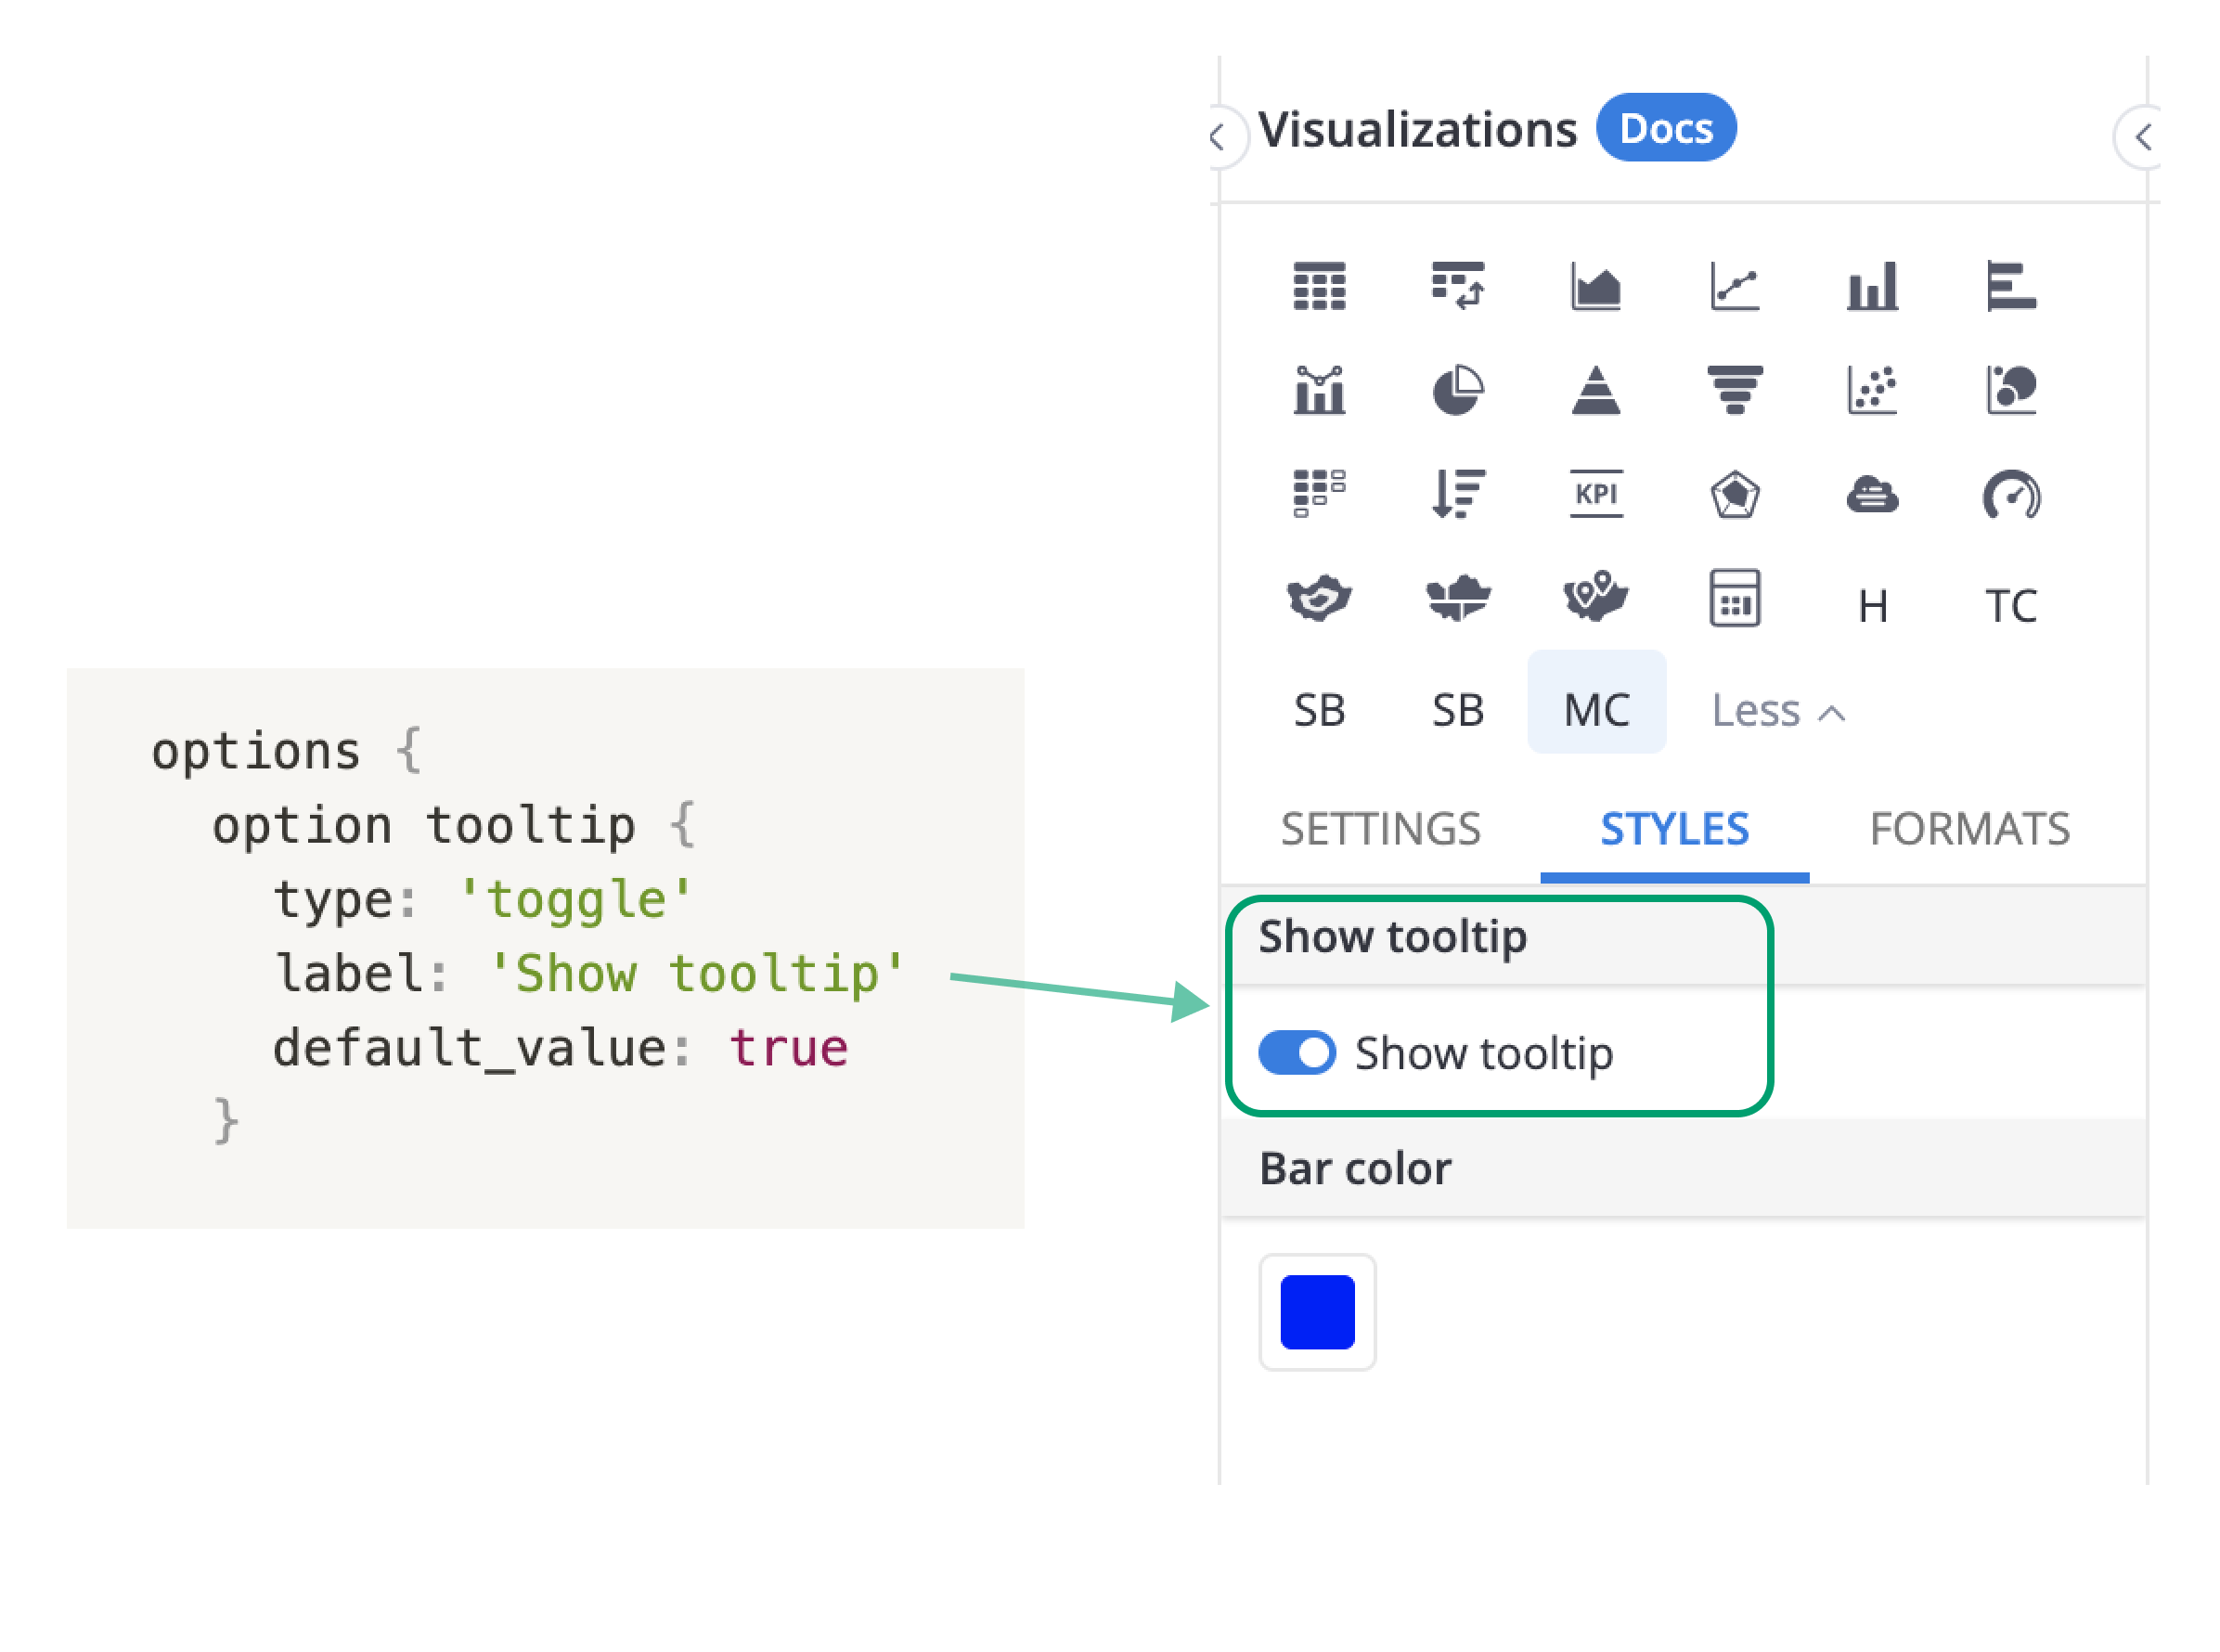
To learn more about the properties of option, visit Custom Chart properties.
Chart Template definition overview
This is written using Vega-lite synxtax. This dictates the visualization properties, such as the shapes (whether it would be bars, points, lines,...), as well as component configurations such as line thickness, dash or dot, X and Y axis definition, breakdown definition, format.
Normally, when you define a Vega-lite chart, it is necessary to hardcode the chart data and fields within the Vega specification. However, to make your Custom Chart template receive the data from your drag-and-drop dataset fields, you will need to use the fields that you have declared in the Field Section like this.
"field": @{fields.field_a.name}
This definition is denoted with the @vgl notation. There are 03 compulsory properties for this field:
- Data: determines what data will be encoded with the Vega-Lite specifications. To learn more about this property, head over to Template definition: “data” property.
- Mark: defines the visualization type (bar, line,…) and other customizations.
- Encoding: maps your data to the visual properties of a mark.
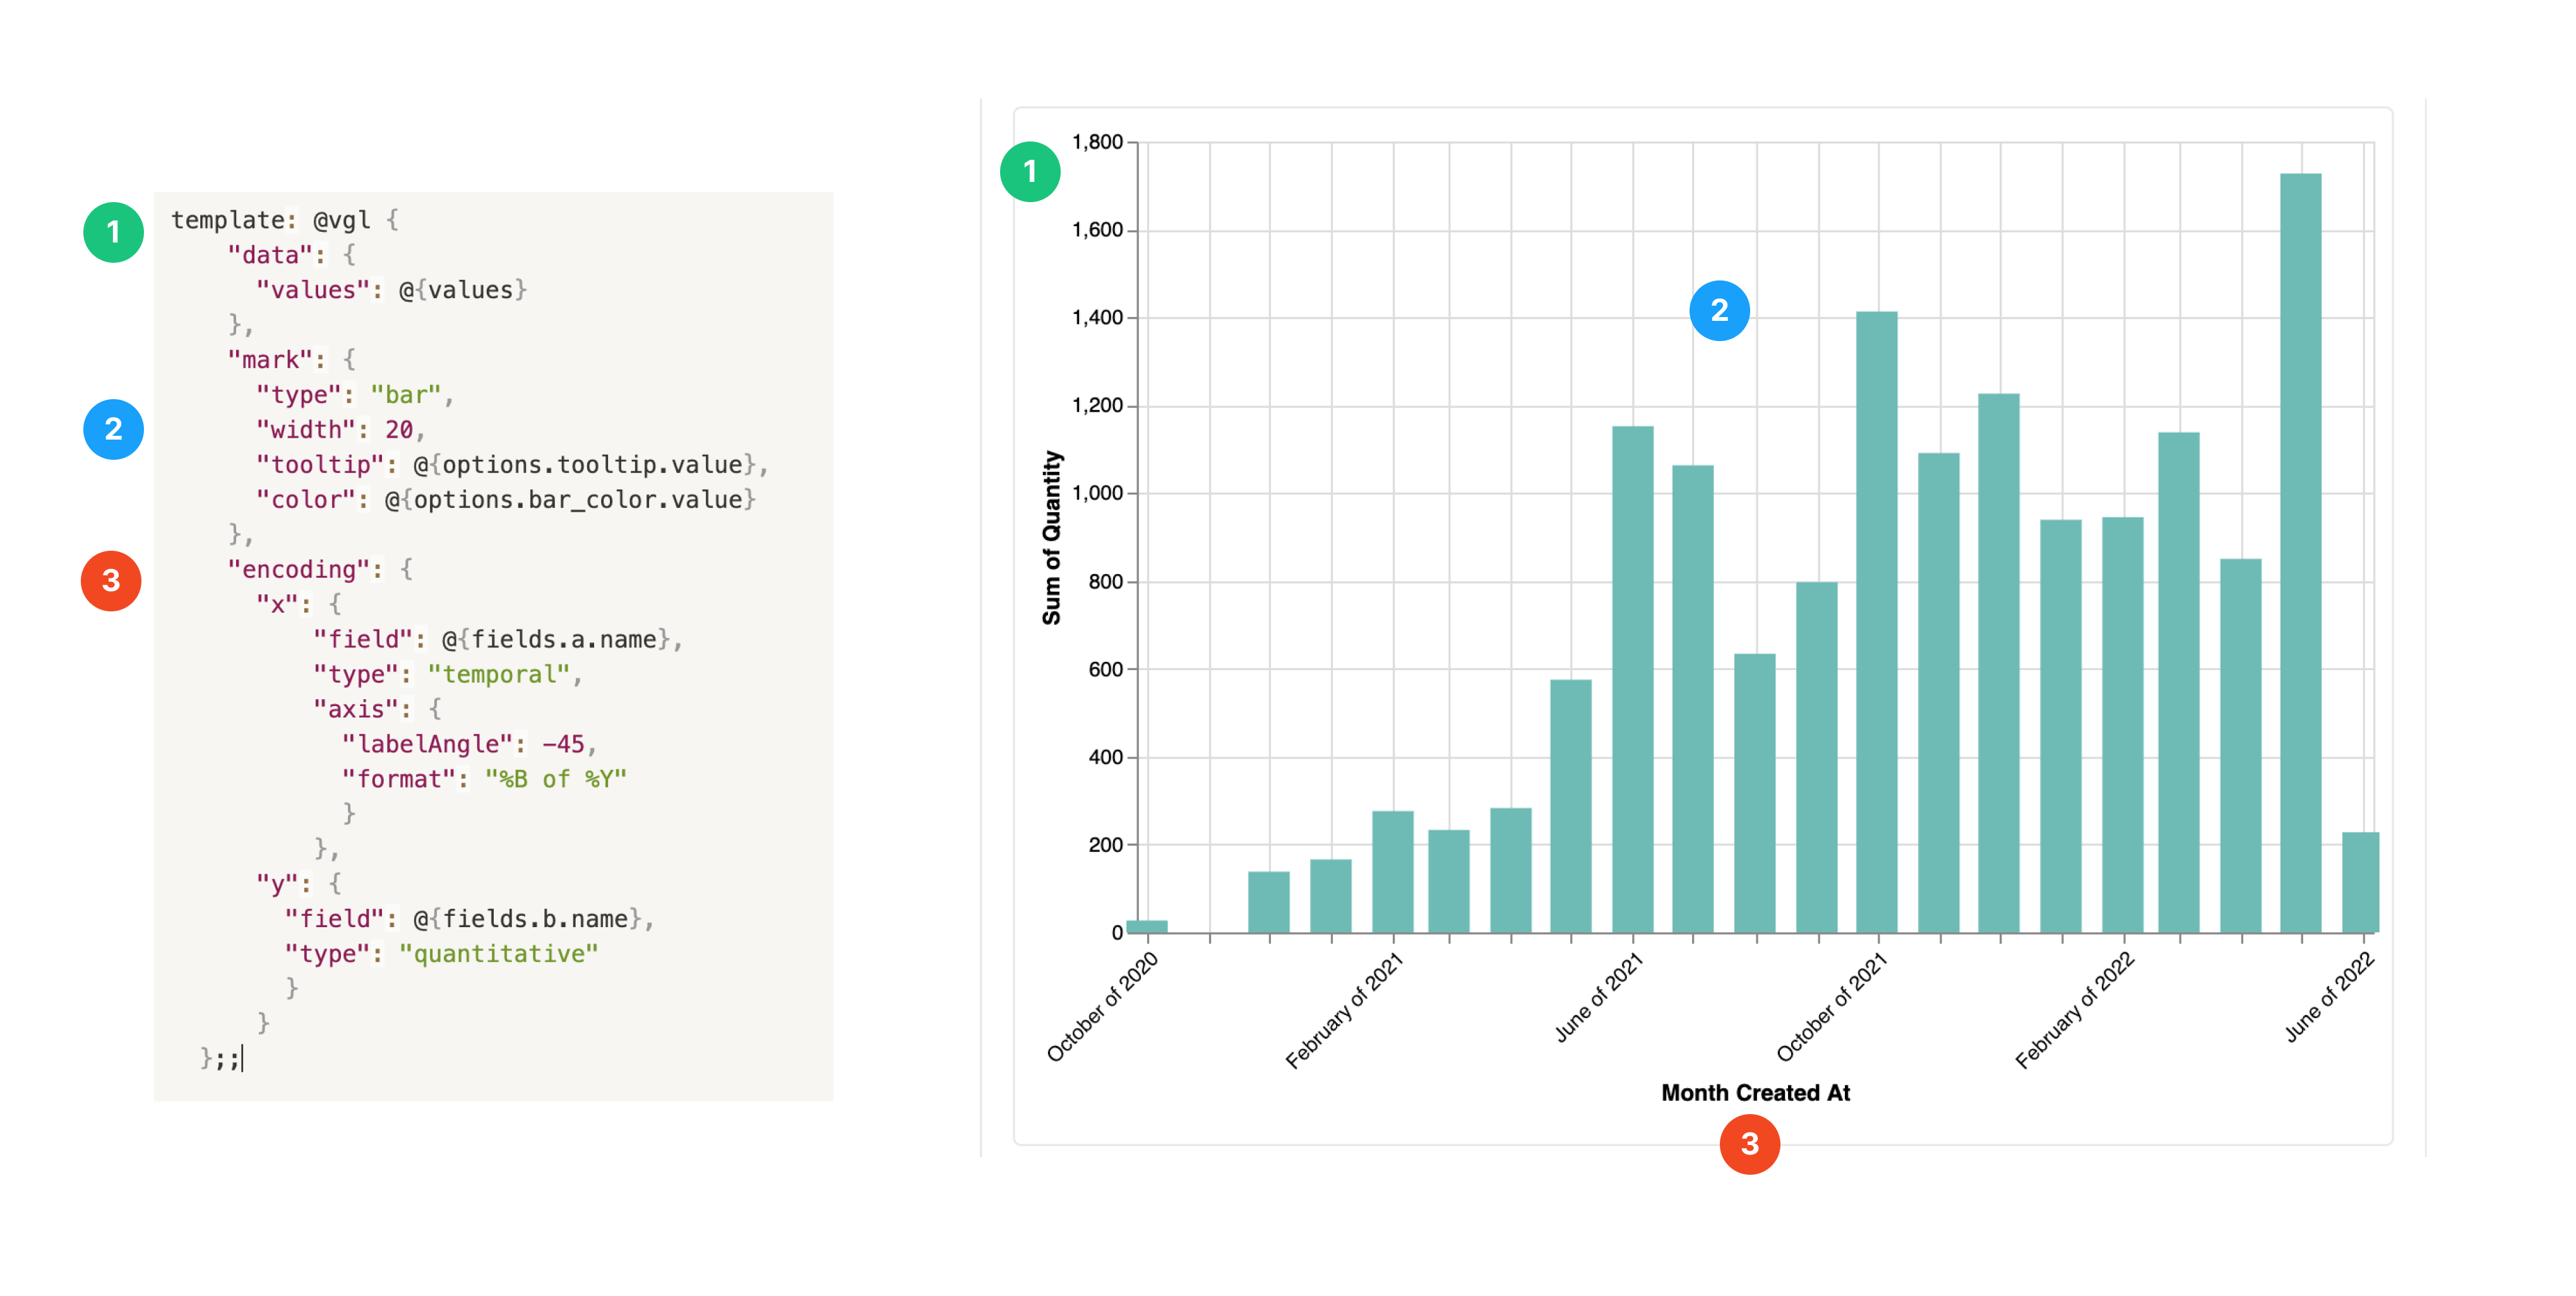
To learn more about these fields, head over to Vega-lite’s documentation.
How to write Vega-lite Chart Template definition
In order to make the Vega-lite syntaxes work with Holistics Exploration UI, i.e to pass the data generated from the drag-and-drop UI to the Vega-Lite specification, you will need to use special syntaxes as detailed below.
Field definition
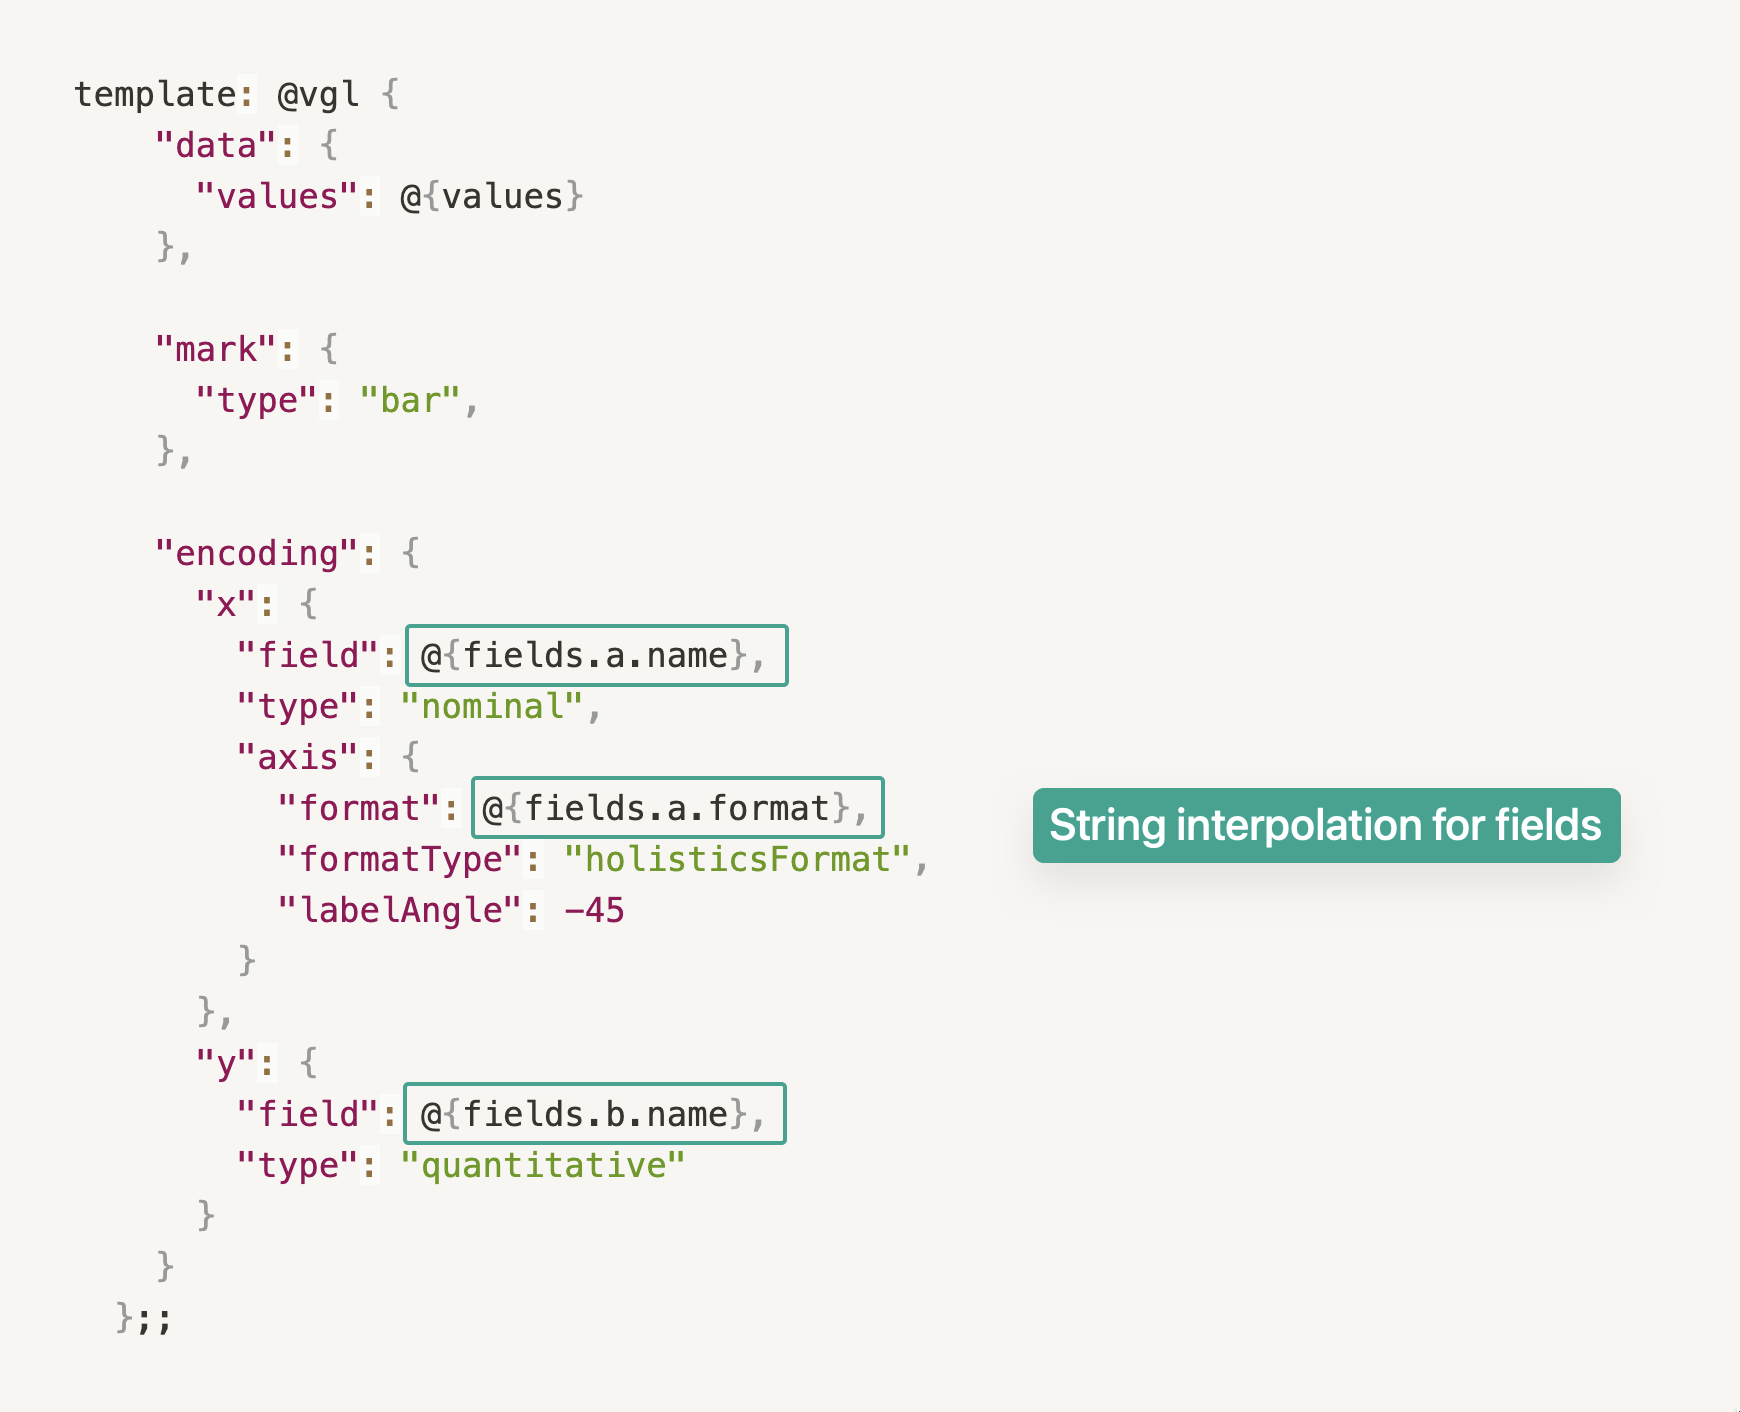
A field can have many properties. To dynamically refer to a field’s property, we would use the string interpolation syntax @{fields.field_name.field_property}.
Learn more about field’s property here: Custom Chart properties.
For example, we have defined two fields called field a and field b:
fields {
    field a {
        type: "dimension"
        label: "field a"
    },

    field b {
        type: "measure"
        label: "field b"
    }
}
We use string interpolation as below to refer to them. Now, whenever the user drags a field into section field a or field b, that field’s value will be used in x-axis or y-axis respectively.
Option definition
We can define options, then refer to them in the other parts of the code without having to copy-paste the same code over and over again.
To dynamically refer an option definition, use this syntax: @{options.option_name}.

Template definition
data property
It is important to use the exact code below whenever you see the “data” property in your Template definition.
The placeholder @{values is implicitly defined by Holistics to refer to the data that end users drag-and-drop into the visualization settings.
// copy and paste the exact code whenever you see "data" mentioned in the Vega-Lite JSON Specifications
"data": {
    "values": @{values}
}
params property
💡 params is a part of Vega-lite official syntax. You can read more about it here: https://vega.github.io/vega-lite/docs/parameter.html
Use params to declare user interactions that your chart accepts. It takes in an Array of user interaction declarations.
A valid user interaction declaration consists of:
"name":This field accepts a String. This is the name of your user interaction declaration."select":This field accepts a String. Optionally, you can pass more options into it. This is the type of your user interaction.
A valid params declaration may look like this:
template: @vgl {
    "params:" [
        // Different types of user interaction declaration
        // 1. A simple Point selection declaration. The name of the selection is "pointSelection",
        // and the type of select is "point".
        { "name": "pointSelection", "select": "point" },
        // 2. More advanced Point selection declaration. The name of the selection is
        // "hightlight" and the select is "point" only on when user hovers over the chart.
        { "name": "highlight", "select": {"type": "point", "on": "mouseover"} }
    ]
}
On its own, params declaration does not do much, but it lays the foundation so that you can create interesting interactive effects with your chart.
Head over to Tutorial: Create Interactive Custom Charts to learn more.
holisticsConfig property
Use holisticsConfig to enable interactive chart features like Cross Filter or Drill-through to be triggered on user’s interactions.
crossFilterSignals
Takes in an Array of valid user selections as input. This configuration enables your chart to listen for declared user selections, and trigger Cross Filter on those interactions.
If you are not sure on how to declare a user selection for your chart, head over to params.
When a user creates a selection whose type matches the input declaration, Cross Filtering feature is automatically triggered.
template: @vgl {
        ...
  "params": [
        // 1. Point selection is declared here
    {"name": "myPointSelection", "select": "point"}
  ],
        ...
    "holisticsConfig": {
        // 2. Point selection now triggers cross filter on your chart
        "crossFilterSignals": ["myPointSelection"],
     }
}
contextMenuSignals
Context Menu contains several interactive features in Holistics, including Explore, Date-drill, Drill-through, etc. The menu will be shown when you right-click on the chart inside a widget/report.
If you enable Context Menu, Explore and Date drill will be ready to use without further configurations.
Drill-through feature, however, requires users to select a data point(s) from the chart. Therefore, to enable Drill-through for your Custom Chart, it is necessary to declare user selections so that your chart can listen for them.
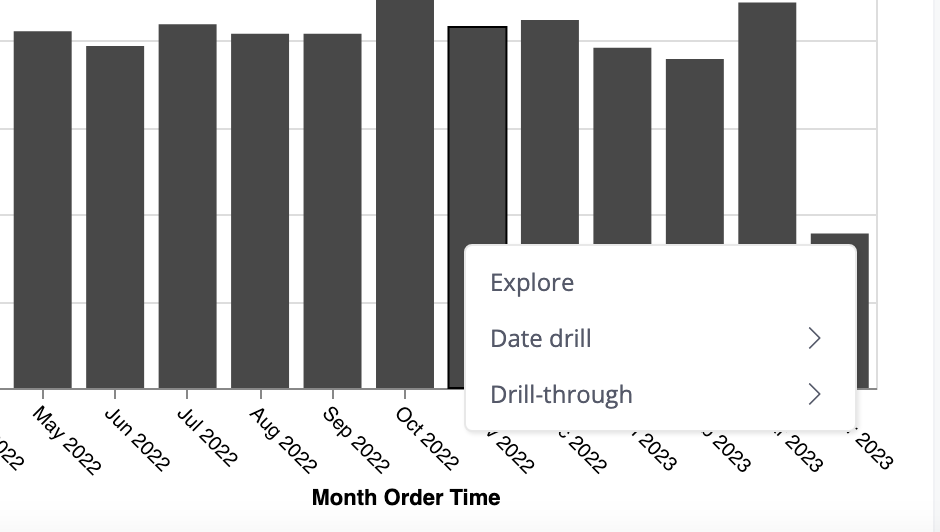
Accepts an Array of valid user selections as input. This configuration enables your chart to listen for declared user selections, and trigger Context Menu on those interactions.
If you are not sure on how to declare a user selection for your chart, head over to params.
When a user creates a selection whose type matches the input declaration, the selected data will become the input params for the Drill-through feature.
template: @vgl {
        ...
  "params": [
        // 1. Point-hover selection is declared here
    { "name": "myHoverSelection",
            "select": { "type": "point", "on": "mouseover" }
      },
  ],
        ...
    "holisticsConfig": {
        // 2. You can trigger Context Menu on hover selection
        "contextMenuSignals": ["myHoverSelection"],
     }
}
With the code above, your Custom Chart now listens for hover interactions. On a hover then right click, user can open the Context Menu. If they select Drill-through functionality, the input data would be the data point that they are hovering on.
Which interaction should I use?
We highly recommend using the interactions below for each type:
- Click selection (as known as point selection in Vega-lite) for
crossFilterSignals(used in this example code). - Hover selection (as known as point-on-hover-selection in Vega-lite) for
contextMenuSignals(used in this example code).
For more information regarding the selection types, please see Custom chart's selection types.
Apply Holistics Format to the Vega-lite fields
To render your Custom Chart with the format settings specified by Data Explorers in the Exploration UI, you can dynamically pass them to the Vega-lite specification.
To do so, simply add the 2 properties below to your fields of encoding property in the Template definition:
"format": @{fields.field_name.format}"formatType": "holisticsFormat"(a custom format type Holistics registered with Vega-Lite)
For example, to apply Holistics format to the fields' axis labels:
"encoding": {
    "x":{
        "field": @{fields.a.name},
        "type": "nominal",
            "axis": {
                "format": @{fields.a.format},
                "formatType": "holisticsFormat"
            }
        },
    "y":{
        "field": @{fields.b.name},
        "type": "quantitative",
            "axis": {
                "format": @{fields.b.format},
                "formatType": "holisticsFormat"
            }
        }
    }
You can also apply it to Legend, Header, Tooltips, etc. in the same way. Please refer to Format | Vega-lite’s documentation for more details.
Acknowledgments
Supported Features
- Holistics’s Interactive features (Explore, Date-drill, Cross-filter, Drill-through, etc.)
- Data Alert and Data schedules for reports
- Export reports to PNG/PDF/Excel/CSV
Limitation Acknowledgments
Not supported yet:
- Multi-view charts (example: Trellis chart)
- Adding more fields or more axes to the Custom charts
Related materials
- Custom Chart properties: This is a reference documentation on available Custom Chart properties.