Tutorial: Create a Custom Chart from Vega-Lite library
Besides default visualization types, you can create and customize your own charts in Holistics using Vega-lite - a grammar of interactive graphics.
- We also have a Holistics Custom Chart Library for example codes of commonly requested charts.
Quick Custom Chart Overview
Only Admins are authorized to create custom chart definitions.
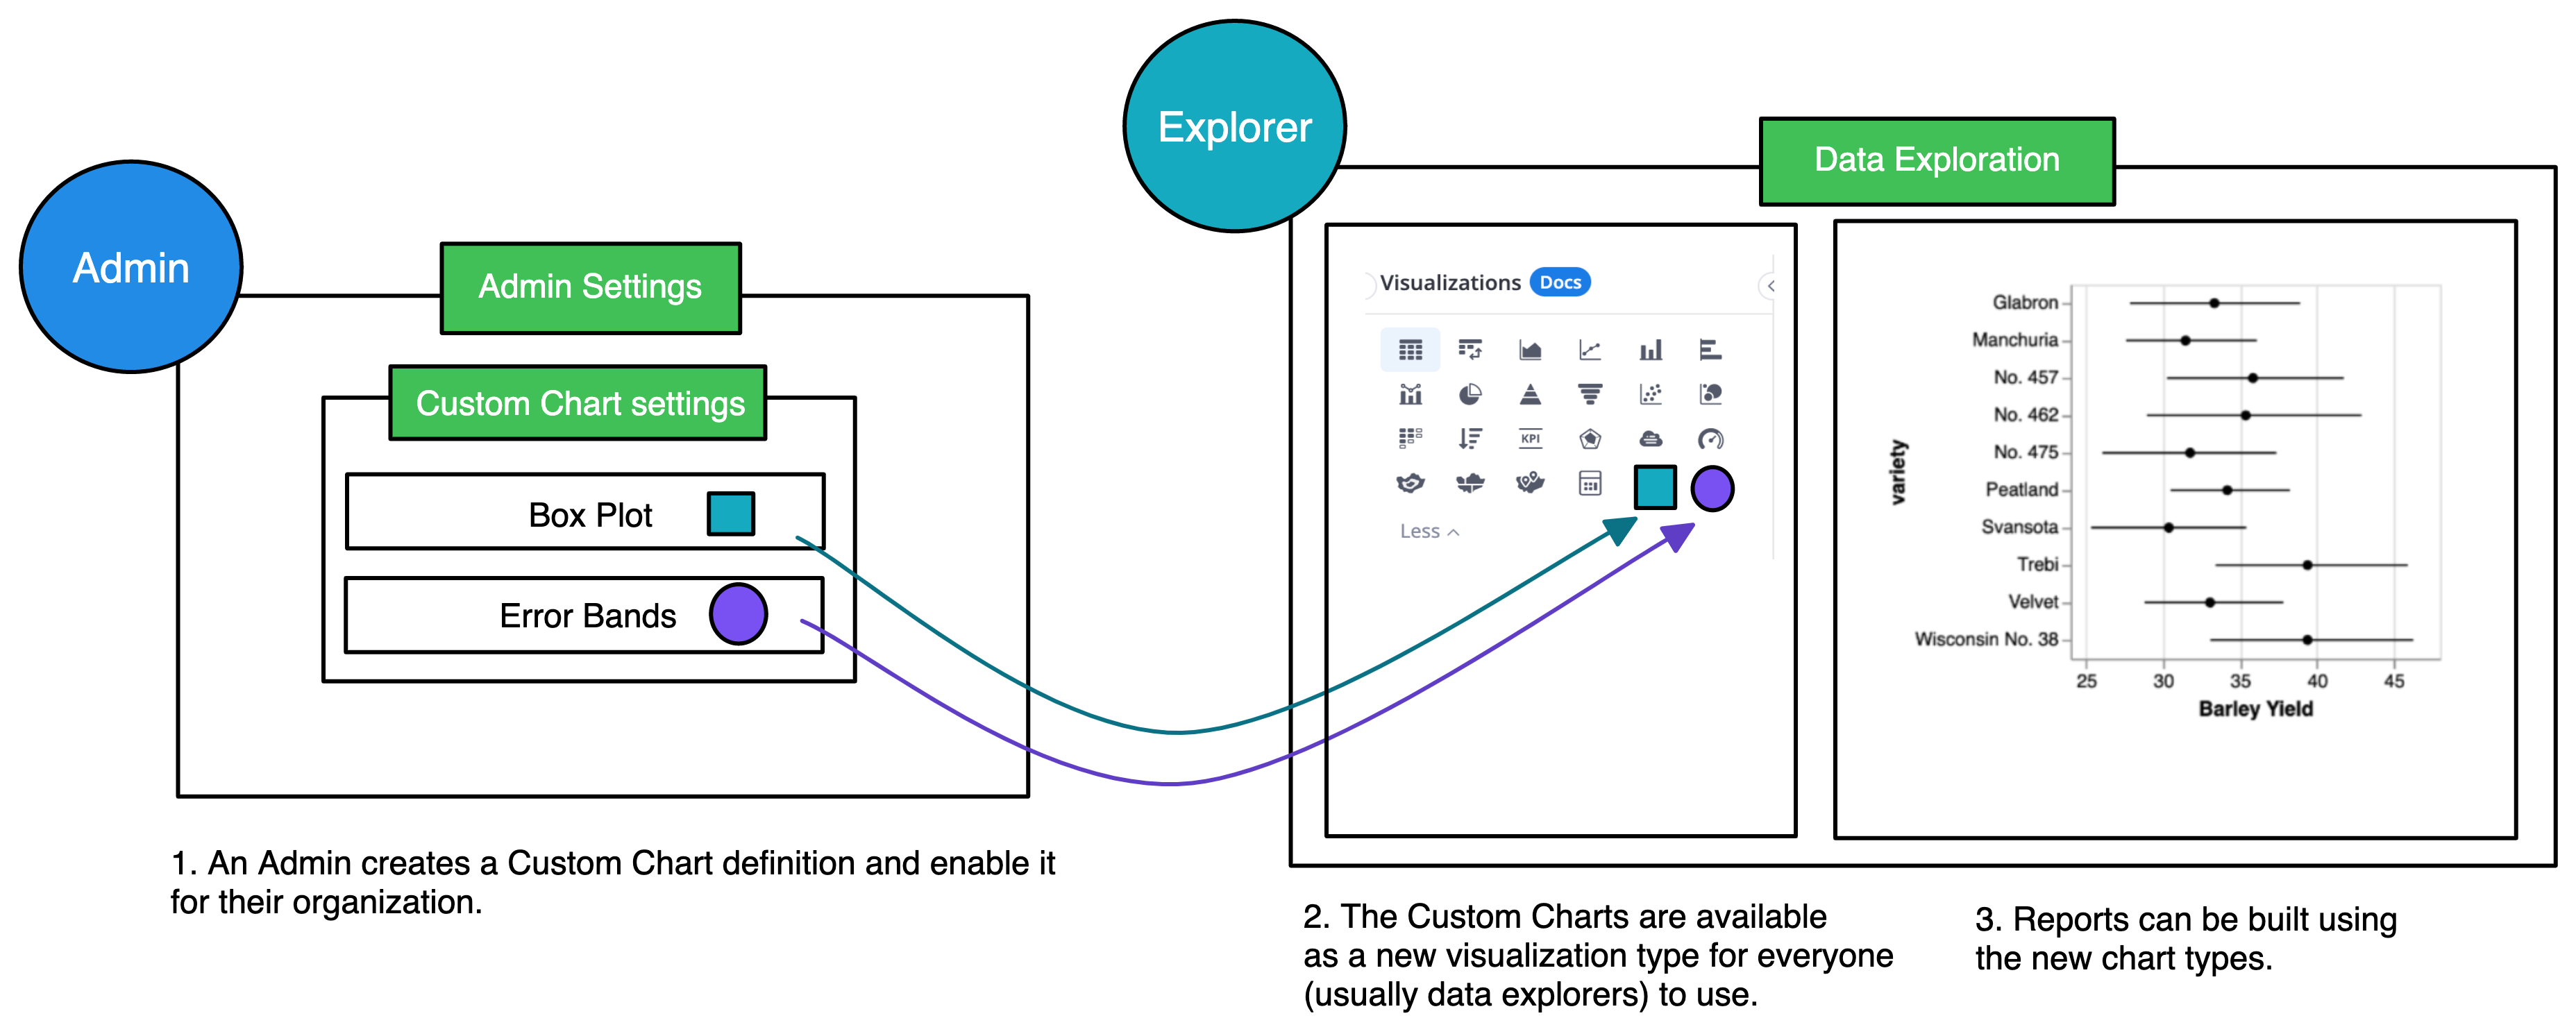
Custom Charts are user-defined chart templates written using Holistics and Vega-lite syntax. Once created, it is available to everyone in your organization to use.
The creation of a Custom Chart typically follows these steps:
- An Admin creates the chart definition. This chart type will then be available in the Data Exploration UI.
- Other users within the organization can select the new chart type to build reports from it.

Step 1: Create your first Custom chart using AML
This tutorial will walk you through the steps to create a Vega-Lite’s Simple Bar Chart in Holistics. This is our expected output:

To create this Simple Bar Chart, you need to go through 2 main steps:
- Create the Custom chart using Holistics AML.
- Build your Report using the new chart.
Step 1.1: Initial setup
- Go to More Settings > Custom Charts > Add Custom Charts to start creating a new custom chart.

- Fill in the Chart name and description. This will be shown when your organization users hover over the chart in the Exploration screen.

A Custom chart comprises of three main components: Field definition (required), Option definition and Template (required).
For this example, we will write the Field definition and Template only.
Step 1.2: Write Field definition
fields {
  _define your fields here_
}
The first step is to determine how many fields are required to create any custom chart.
Looking at the example chart, we know that there are two required fields to create this Simple Bar Chart: a and b.
So we define these two fields as below:
CustomChart {
    fields {
        field a {
            type: "dimension"
            label: "field a" // display in Visualization settings
            // you can use a more descriptive label so your users won't be confused
        }

        field b {
            type: "measure"
            label: "field b"
        }
    }
To learn more about Field definition, visit Custom chart documentation | Field definition.
Step 1.3: Write Template
template: @vgl {
    _insert vega-lite JSON specifications here_
} ;;
The Template is where you write the Vega specifications that render the final visualizations. To learn more about Template visit Custom chart documentation | Template.
In this example, the Vega specifications are already written by the Vega team, so we can reuse them.
- Copy the Vega-lite JSON Specifications from the example, paste them in
_insert vega-lite JSON specifications here_
- Modify the required template properties using string interpolation (learn more about string interpolation in Custom Chart here Our final code will look like below. You can customize your charts to your business needs by following Vega-Lite documentations.
CustomChart {
    fields {
        field a {
            type: "dimension"
            label: "field a"
        }

        field b {
            type: "measure"
            label: "field b"
        }
    }

    template: @vgl {
        "data": {
            "values": @{values} //string interpolation that receives Holistics data
        },
        "mark": "bar",
        "encoding": {
            "x": {
                "field": @{fields.a.name}, //string interpolation that refers to field a
                "type": "nominal",
                "axis": {
                    "labelAngle": -45
                }
            },
            "y": {
                "field": @{fields.b.name}, //string interpolation that refers to field b
                "type": "quantitative"
            }
        }
    };;
} - Click Submit. Now, anyone in your organization will be able to create a report with the custom chart using the drag-and-drop interface.
Step 2: Build a report with the new Custom Chart
In the Visualization settings, choose the icon of the custom chart you want. The icon will be the first two letters of the custom chart initials.

Now, you can drag and drop your fields into the corresponding section to start creating the Simple Bar Chart.

Any changes made to the original code of the custom charts will be reflected on all the reports that use that chart type.